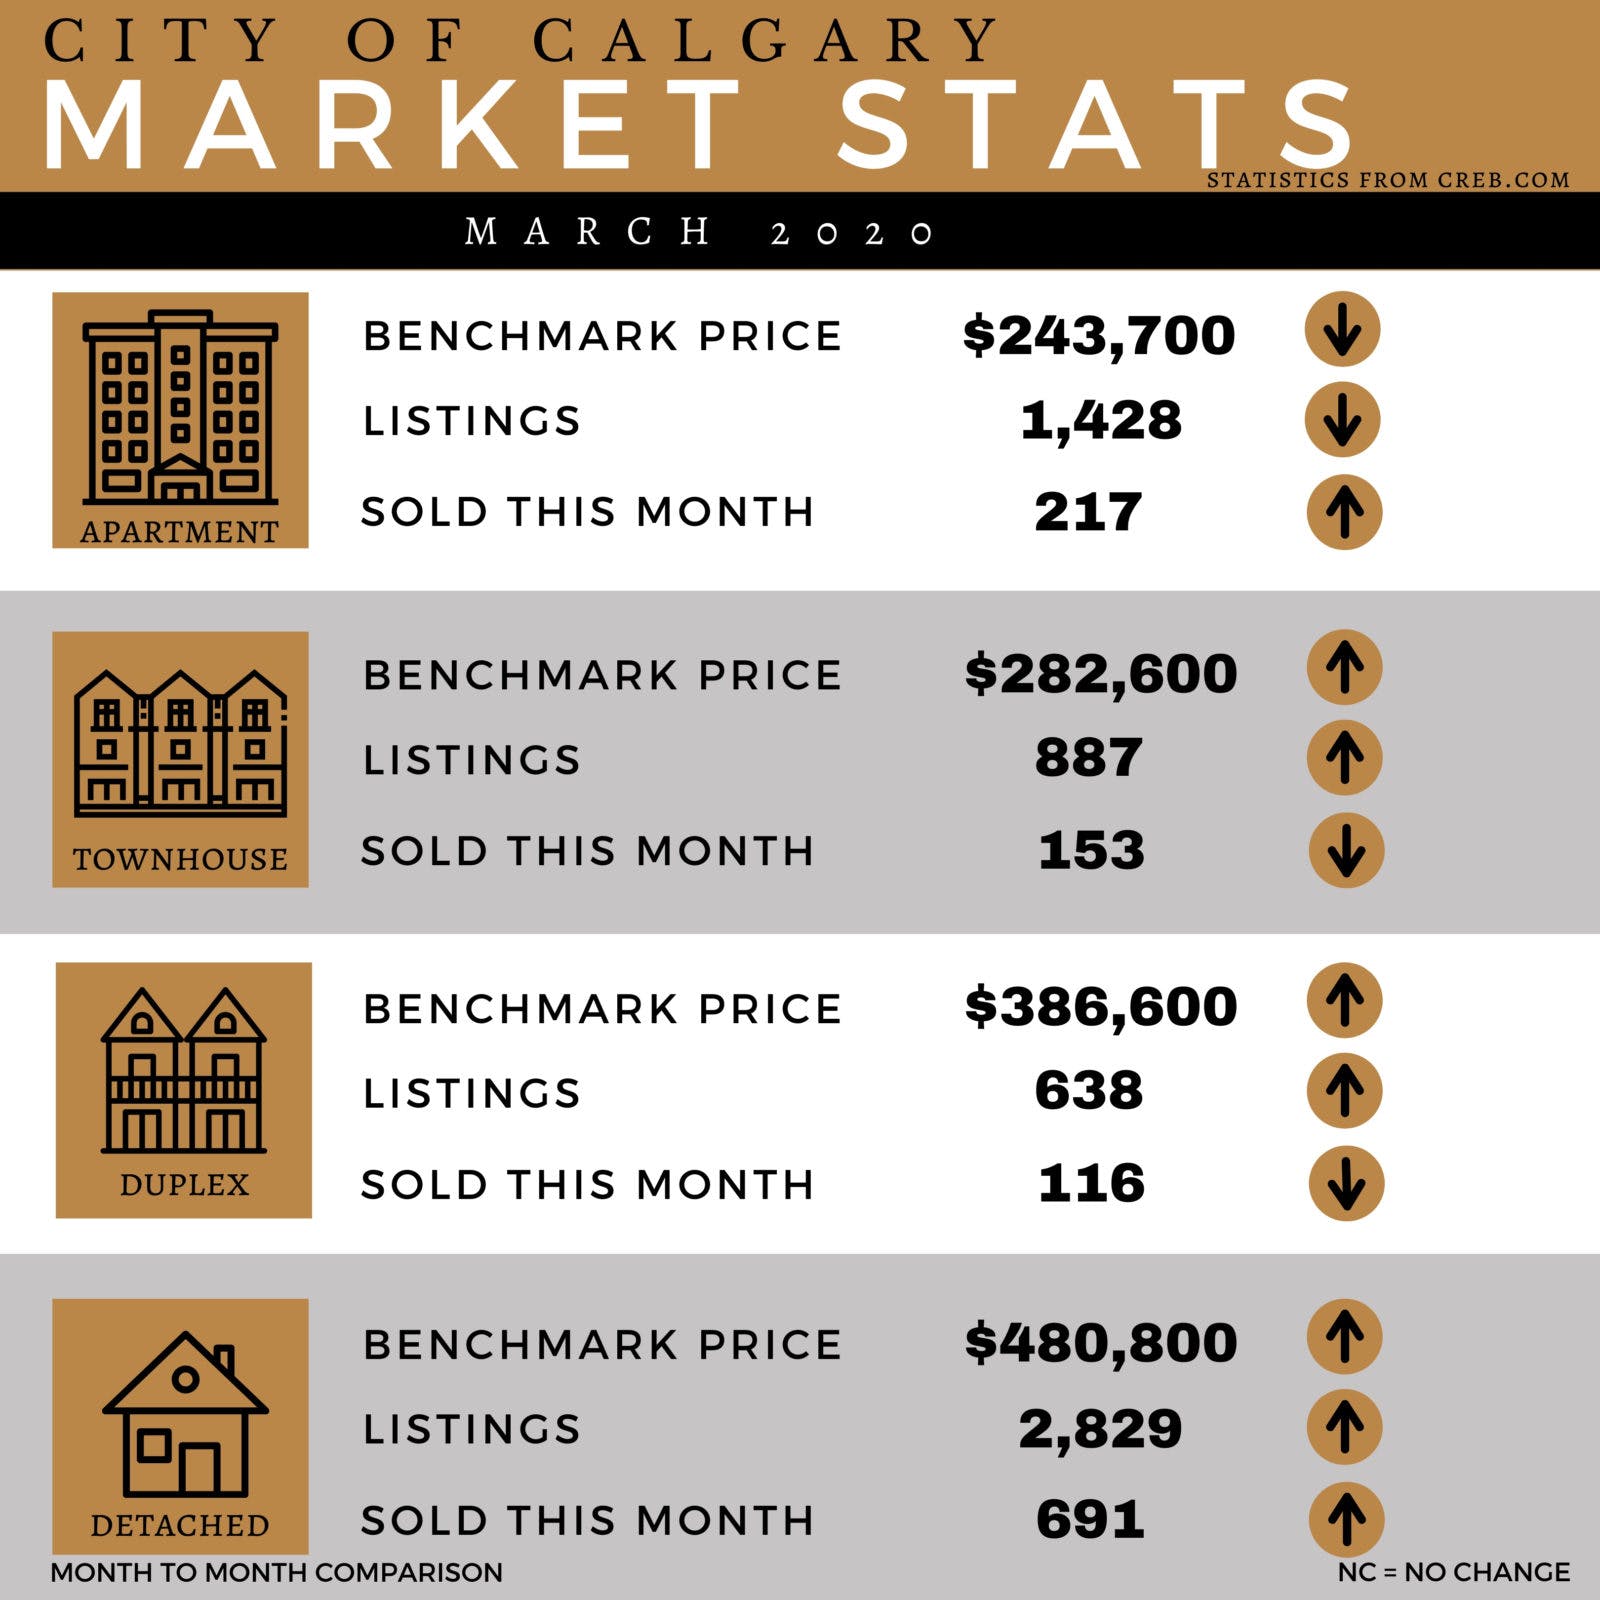
How’s the Market? An Overview
Well, things were off to a great start and then…well, you all know what happened. Normally March is a busy month for Calgary real estate, especially with the number of listings that come to the market. At first, the pace was brisk. But as the pandemic gripped our city, the number of houses being listed slowed dramatically. Compared to March of 2019, we saw a 21% drop in the number of detached properties listed for sale. We also saw a 15% decrease in detached home sales compared to March 2019. Sales activity hasn’t been this slow since 1995.
As schools and businesses closed, so did open houses. Fewer and fewer showing requests are being made. We looked into our own numbers and found that home tours are down by 85%. Now houses are viewed virtually, and extra precautions are taken to protect both buyers and sellers. We posted Tips for Buyers and Sellers During the COVID-19 Crisis an article which offers helpful information and shares our procedures as we move forward during these difficult times. Even with these obstacles, we’ve found that technology has made it possible to still buy and sell real estate. Thanks to FaceTime and Zoom we’re able to meet with clients and walk them through properties. We can sign documents using programs like Docusign. It’s amazing how adaptable everyone has been, and how transactions are still happening smoothly despite Covid-19.
It’s important to note that the statistics below showcase the change compared to February of 2020. Normally we see a spike in the number of listings and transactions as the spring market heats up during this time of year. Next month’s numbers will probably tell a more accurate story of how the Corona virus has affected Calgary real estate since the first half of March was business as usual.
Since each district of Calgary often has its own market conditions, we’ve further broken down the information provided by the Calgary Real Estate Board (CREB) so that you can compare your property to others in the same district.
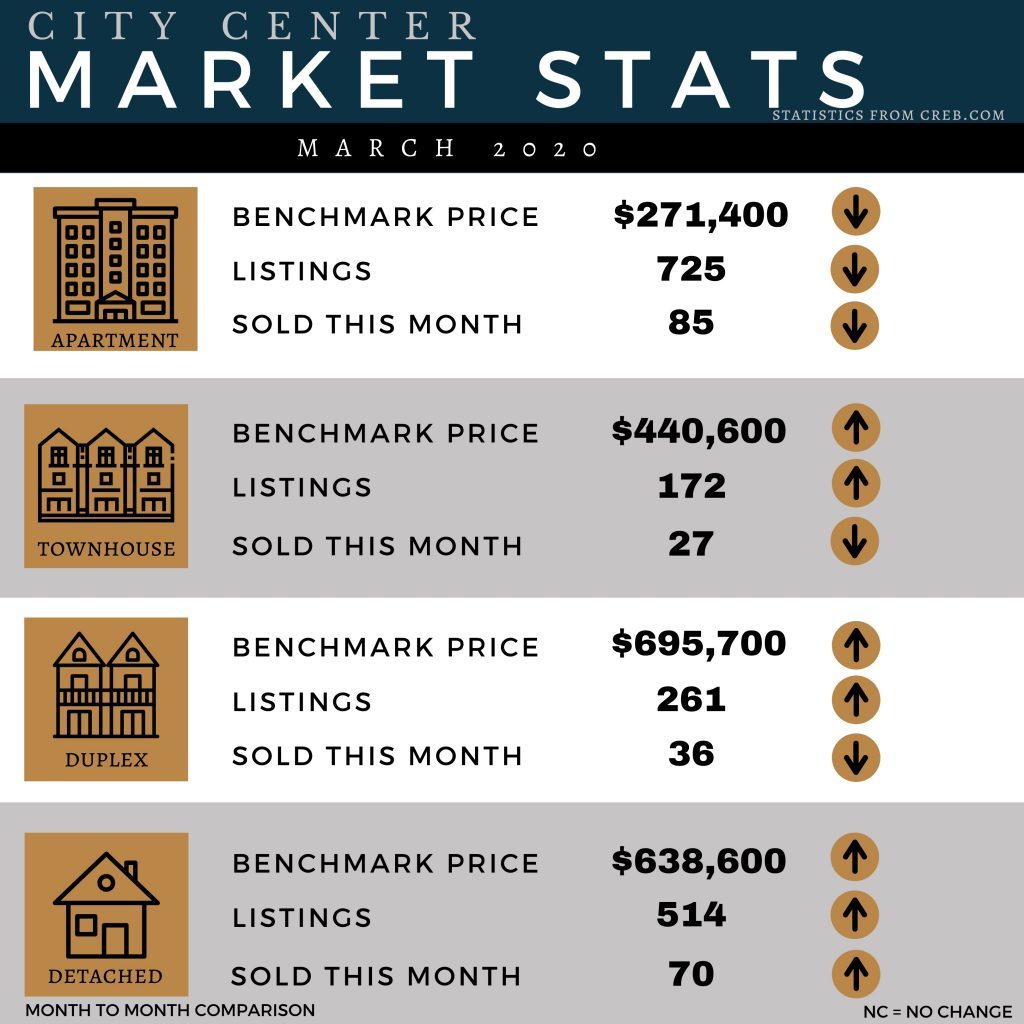
City Center Update
The City Center district includes the areas that are in closest proximity to the downtown core. The sales statistics for Rosemont, West Hillhurst, Bridgeland, Inglewood and other NW, NE and SE neighbourhoods are covered here. Erlton, Mission, Roxboro, Parkhill, Elboya, Windor Park, Bel-Aire, Mayfair, Britannia, Elbow Park, Rideau Park, Mount Royal, Altadore, South Calgary, Garrison Woods, Richmond, Kilarney, Bankview are found in this district. Also, the East Village, Beltline and the Downtown Core fall into this category.
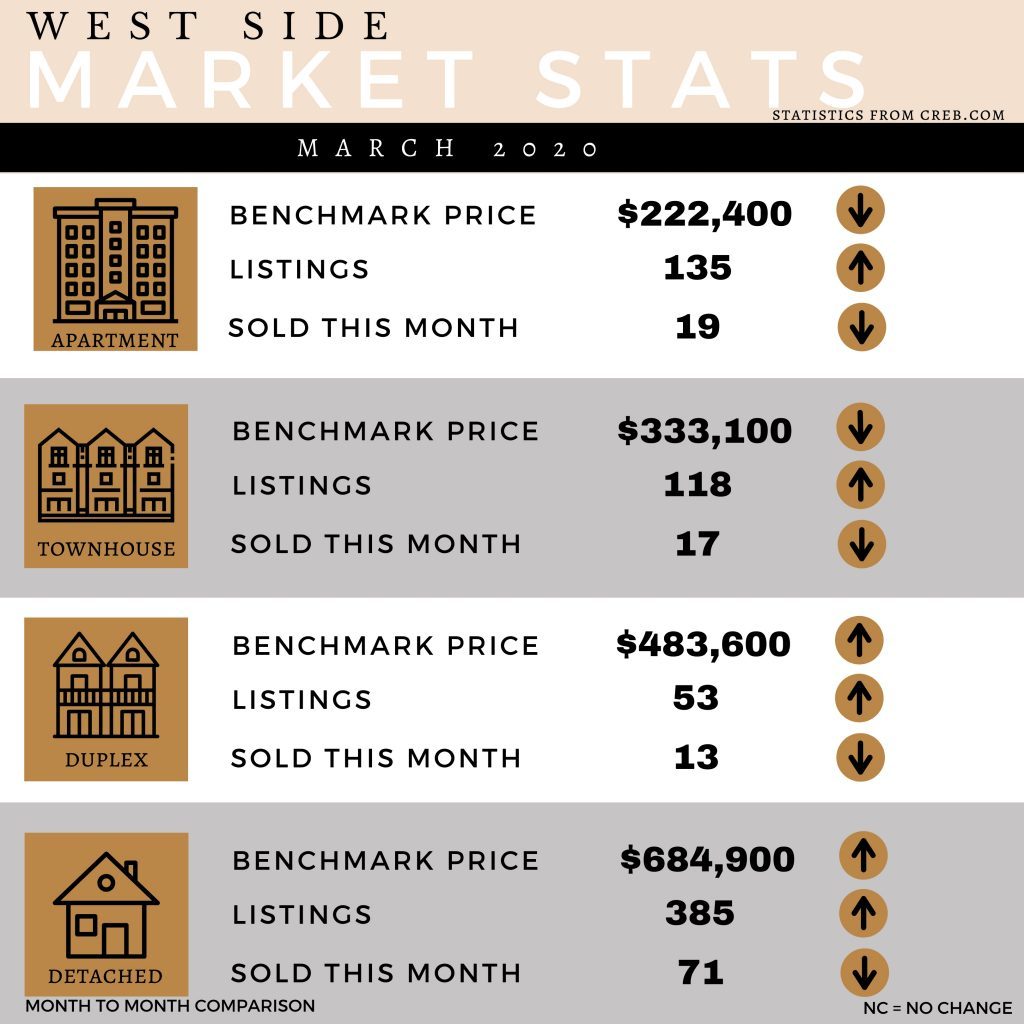
West Side Update
The West Side covers all the neighbourhoods west of Sarcee Trail, otherwise known as the WestHills. This district also includes Valley Ridge, Crestmont, Discovery Ridge, Lakeview, Garrison Green, North Glenmore Park, Lincoln Park, Currie Barracks, Rutland Park, Glamorgan, Glenbrook, Glendale, Rosscarrock, Westgate, Spruce Cliff and Wildwood.
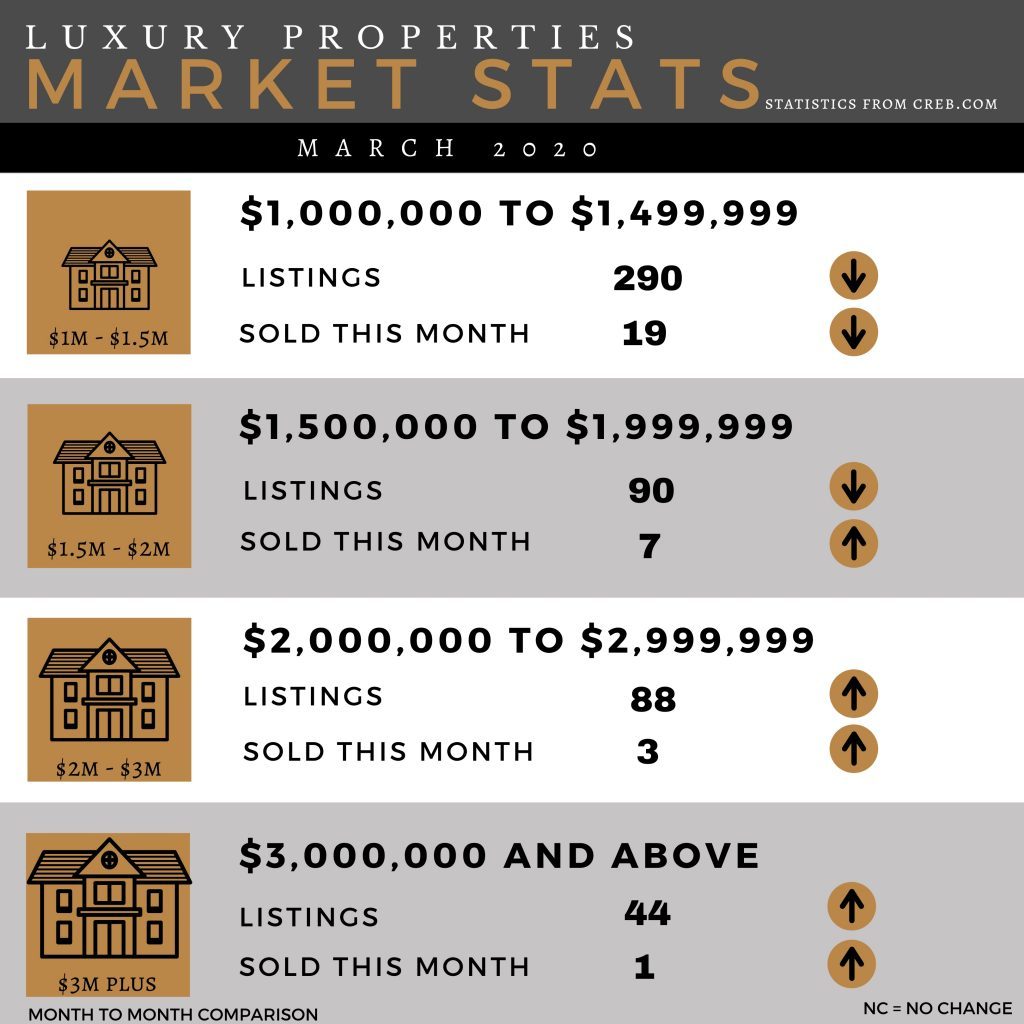
Luxury Update
We’ve further analyzed the stats on houses prices over $1,000,000 and divided them into price groups. The biggest drop in number of sales is in the $1M to $1.5M group. In February of 2020 25 houses were sold in this price category compared to 19 sold this March. The one sale over $3,000,00 was in the neighbourhood of Mount Royal. This house was originally listed at $4,950,000 and was on the market for close to a year.